
Core Web Vitals are Google’s three real-user metrics for page experience: Largest Contentful Paint (loading), Interaction to Next Paint (responsiveness) and Cumulative Layout Shift (visual stability). A site that fails them loses customers because visitors wait, tap buttons that don’t respond, or misclick when content jumps, and many leave before buying or requesting a quote.
Most failures on small-business sites come from a short list of causes: an oversized hero image, too many plugins and third-party scripts, or budget hosting with no caching. Find the one that applies to you, fix it first, and work down the list.
This guide covers the official thresholds from web.dev, how to read field and lab data without getting confused, what typically breaks on WordPress, Elementor and Shopify sites, and a prioritized fix list you can hand to your developer.
Key takeaways
- Core Web Vitals are LCP (loading), INP (responsiveness) and CLS (visual stability), measured from real Chrome users at the 75th percentile.
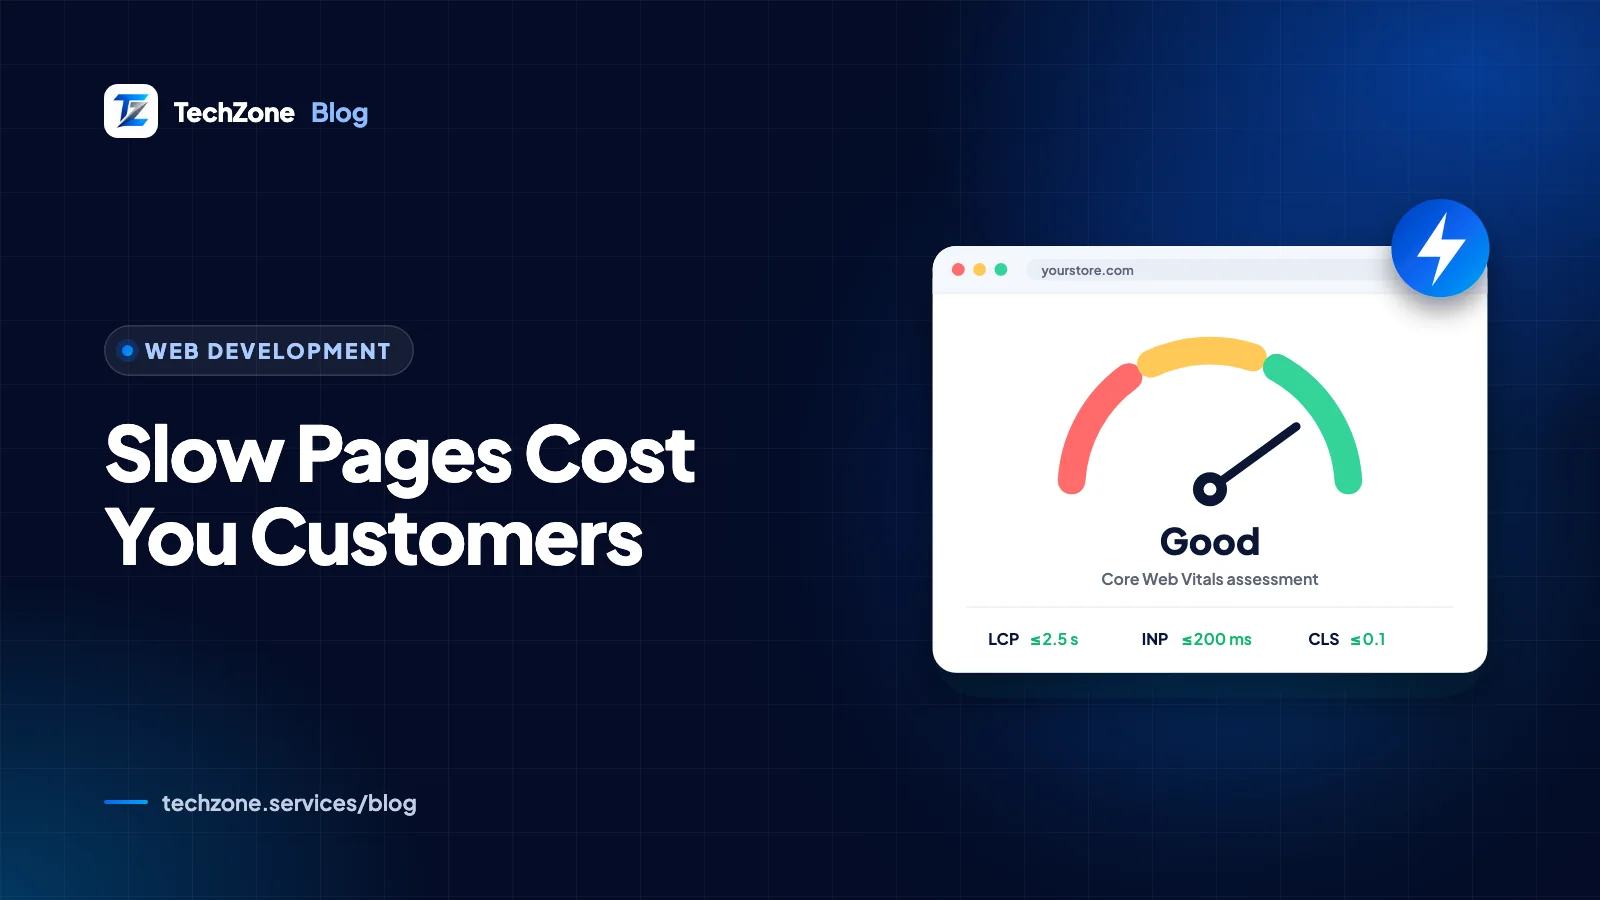
- Good scores are an LCP of 2.5 seconds or less, an INP of 200 milliseconds or less, and a CLS of 0.1 or less.
- INP replaced First Input Delay (FID) as a Core Web Vital on March 12, 2024.
- Field data from CrUX and Search Console decides whether you pass; Lighthouse lab scores are for debugging, not the final verdict.
- Core Web Vitals are one part of page experience in Google Search; relevant, helpful content still matters more for rankings.
What are Core Web Vitals?
Core Web Vitals are three metrics Google uses to describe how a page feels to real visitors: how fast the main content appears, how quickly the page reacts to input, and how stable the layout stays. They are part of Google’s wider Web Vitals program, documented on web.dev.
The current set is Largest Contentful Paint (LCP), Interaction to Next Paint (INP) and Cumulative Layout Shift (CLS). INP replaced First Input Delay (FID) on March 12, 2024. FID only measured the input delay of the first interaction on a page; INP observes all clicks, taps and key presses during a visit, from the input until the browser paints the next frame.
Each metric is assessed at the 75th percentile of page visits, separately for mobile and desktop. In plain terms, a metric passes when at least three out of four visits meet the “good” threshold.
What is a good LCP, INP and CLS score?
A page passes when LCP is 2.5 seconds or less, INP is 200 milliseconds or less, and CLS is 0.1 or less, all measured at the 75th percentile. The table shows the full bands Google uses in PageSpeed Insights and Search Console.
| Metric | What it measures | Good | Needs improvement | Poor |
|---|---|---|---|---|
| LCP (Largest Contentful Paint) | Time until the largest image or text block in the viewport renders | 2.5 s or less | Over 2.5 s up to 4.0 s | Over 4.0 s |
| INP (Interaction to Next Paint) | Delay between a click, tap or key press and the next visual update | 200 ms or less | Over 200 ms up to 500 ms | Over 500 ms |
| CLS (Cumulative Layout Shift) | How much visible content moves unexpectedly | 0.1 or less | Over 0.1 up to 0.25 | Over 0.25 |
LCP in practice
On most business sites the LCP element is the hero image, a banner slider or the main headline. That makes LCP largely a question of how quickly one specific file reaches the browser and gets painted.
INP in practice
INP counts clicks, taps and key presses; scrolling and hovering are excluded. Menus, add-to-cart buttons, product filters and form fields are where slow INP shows up, usually because JavaScript is keeping the browser’s main thread busy.
CLS in practice
CLS is the “I tried to tap Buy and hit something else” problem. Images without dimensions, late-loading banners, cookie bars that push content down, and web fonts that swap in at a different size are the usual sources.
How do you measure Core Web Vitals: field data or lab data?
Field data from real visitors decides whether you pass; lab data from a simulated test helps you find out why. Use both, but never judge success by a Lighthouse score alone.
- Chrome User Experience Report (CrUX): Google’s public dataset of real-user metrics from opted-in Chrome users. It only covers pages and origins with enough traffic.
- Search Console Core Web Vitals report: built on CrUX data, it groups similar URLs and splits results by mobile and desktop. After a fix, you can start a validation that monitors the issue for 28 days.
- PageSpeed Insights: shows CrUX field data from the previous 28 days at the top and a Lighthouse lab test underneath. If a URL lacks field data, it falls back to origin-level data, or shows none.
- Lighthouse and Chrome DevTools: lab tools for debugging. Lighthouse cannot measure INP because nobody is interacting with the page, so it reports Total Blocking Time (TBT) as a proxy.
Lab and field numbers often disagree. A Lighthouse run uses a cold cache, one device profile and one network speed, while real visitors bring cached files, different phones, patchy mobile connections and their own cookie choices. A page can post a good TBT in the lab and still have poor INP in the field.
Tip
New or low-traffic sites often have no CrUX data yet. Test your key templates (home, service page, product page, blog post) in Lighthouse on the mobile profile, and add real-user monitoring with Google’s open-source web-vitals JavaScript library so you collect your own field data from day one.
Why does a slow website cost you customers?
Speed costs customers because every delay happens at a decision point: the first impression, the tap on a button, the form submit. Visitors rarely complain; they press Back and pick a competitor from the same results page.
- Paid traffic leaks first. You pay for the ad click whether or not the landing page loads. A visitor on a mid-range phone who stares at a blank hero area often leaves before the page renders, and that click is spent.
- Slow INP looks like a broken site. When a tap on “Add to cart” or “Get a quote” takes a noticeable moment to respond, people tap again, submit twice, or assume the site doesn’t work.
- Layout shift causes wrong clicks. A button that jumps as a banner loads sends people to the wrong page or product, which erodes trust in a checkout or booking form.
- Slowness signals neglect. Visitors read a sluggish site as a sign of a sluggish business. That matters most for service companies that sell on credibility.
Google’s web.dev team publishes case studies from companies such as Vodafone and redBus that linked LCP and INP improvements to higher sales. Your own analytics are better evidence for your business: compare conversion rate by device and landing page in GA4, and look for mobile pages with low engagement.
Speed is one part of turning visitors into enquiries; our guide on how to increase your website conversion rate covers the rest.
What slows down WordPress, Elementor and Shopify sites?
Most slow WordPress, Elementor and Shopify sites share the same seven problems: oversized hero images, render-blocking code, web fonts, third-party scripts, images without dimensions, heavy page builders and budget hosting. Nearly all are introduced during the build and are inexpensive to fix once spotted.
- Oversized hero images. A full-width PNG exported at print resolution is one of the most common LCP problems. Hero images set as CSS backgrounds are also discovered later than an
imgtag in the HTML, which delays the download. - Render-blocking CSS and JavaScript. Every plugin, theme feature and builder widget can add its own stylesheet and script to every page, and the browser has to process many of them before it paints anything.
- Web fonts. Several font families and weights loaded from a third-party server delay text rendering and can shift the layout when the real font replaces the fallback.
- Third-party scripts. Chat widgets, heatmaps, duplicate analytics and ad tags, social feeds and review badges compete for the main thread, which hurts INP in particular. On Shopify, installed apps are a frequent source of extra scripts.
- Images and embeds without dimensions. Images, videos and ad slots without
widthandheightattributes (or a CSSaspect-ratio) reserve no space, so content jumps when they arrive. - Heavy page builders. Elementor and similar builders make editing easy but add wrapper elements and assets. Older layouts built from nested sections, columns and inner sections produce a deep DOM; Elementor’s Flexbox containers use fewer wrappers.
- Budget hosting with no caching or CDN. A slow server response (Time to First Byte) delays everything after it. Without page caching, WordPress rebuilds each page from the database on every visit, and without a CDN, a UK or UAE audience served from a server on another continent waits longer for every file.
For platform-specific fixes, see how to speed up a WordPress site and how to speed up a Shopify store.
How do you fix Core Web Vitals? A prioritized fix list
Fix in order of impact: identify which metric fails on which template, then remove the biggest bottleneck for that metric before touching anything cosmetic. This order works for most WordPress, WooCommerce and Shopify sites.
- Confirm the problem with field data. Open the Search Console Core Web Vitals report or PageSpeed Insights and note which metric fails on mobile and which URL groups are affected. Fix templates, not individual pages.
- Fix the server if Time to First Byte is slow. Turn on full-page caching, add a CDN, keep PHP and WordPress current, and move off overcrowded shared hosting if response times stay high. Remove redirect chains in front of key landing pages.
- Make the LCP element fast. Resize and compress the hero image, serve WebP or AVIF, use a real
imgtag instead of a CSS background, addfetchpriority="high", and never lazy-load it. Replace an autoplay slider with one strong static image. - Cut render-blocking resources. Remove plugins and apps you don’t need, stop loading scripts and styles on pages that don’t use them, defer non-critical JavaScript, and reduce or inline critical CSS.
- Audit third-party scripts. List every tag in your theme and Google Tag Manager, delete what nobody uses, and delay chat widgets and heatmaps until the page is idle or the visitor interacts. This is often where INP problems start.
- Stop layout shifts. Set width and height on every image and video, reserve space for embeds, ads and cookie banners, and never insert content above what the visitor is reading.
- Tame web fonts. Limit families and weights, self-host fonts where the license allows, preload only the files used above the fold, and pick a
font-displayvalue and fallback font that keep shifting to a minimum. - Re-measure and validate. Confirm each fix in Lighthouse, then start validation in Search Console and watch field data over the following weeks, since CrUX reports a rolling 28-day window.
Do Core Web Vitals affect Google rankings?
Yes, as one part of page experience, but not as a dominant ranking factor. Google says its core ranking systems look to reward content that provides a good page experience, while relevance and helpful content come first.
Google Search Central is explicit on both points. It says there is no single page experience signal, that its systems look at a variety of signals, and that Search shows the most relevant content “even if the page experience is sub-par.” It also states that good results in its reports don’t guarantee top rankings.
In practice, Core Web Vitals matter most when several pages answer a query equally well. Google’s own guidance is that when lots of helpful content is available, a great page experience can contribute to success. A fast page with thin content won’t outrank a slower page that answers the question better.
The stronger business case is conversions: visitors you already earn through search or ads are more likely to stay and act on a fast page. Speed work belongs in the same plan as your SEO strategy, next to crawlability, content and links. If you’re launching or relaunching a site, our technical SEO checklist for a new website covers the rest of the foundation.
How TechZone can help
TechZone builds and rebuilds WordPress, Elementor, WooCommerce and Shopify sites with performance planned from the first wireframe: properly sized images, lean themes, careful plugin and app choices, and caching and CDN setup. For an existing site, we start from your field data, find which templates fail and why, and work through the fix list above in order of impact. See our web development services, or if you’re still choosing a platform, read our Shopify vs WooCommerce comparison. Our SEO audit service turns these checks into a fix list ordered by impact. For a review of your site’s Core Web Vitals, get in touch.
Frequently asked questions
Do Core Web Vitals scores differ between mobile and desktop?
Yes. Google assesses Core Web Vitals separately for mobile and desktop visits, and the Search Console Core Web Vitals report shows the two side by side. Mobile results are often worse because phones have slower processors and many visitors browse on mobile networks. Because Google uses mobile-first indexing, fix the mobile experience first, then confirm that desktop pages still pass.
How long does it take for Core Web Vitals improvements to show up?
Core Web Vitals field data in CrUX and PageSpeed Insights covers a rolling 28-day window, so improvements appear gradually over roughly four weeks after a fix goes live. Lab tools such as Lighthouse show the change immediately. In Search Console, starting validation on a Core Web Vitals issue begins a 28-day monitoring period before the issue is marked as fixed.
Do I need a Lighthouse performance score of 100?
No. A Lighthouse performance score of 100 is not required, and Google does not use the Lighthouse score to assess Core Web Vitals. Search Console and Google’s ranking systems rely on field data from real Chrome users. A page with a modest Lighthouse score can still pass all three Core Web Vitals in the field, and a high-scoring page can still fail INP for real visitors.
Can a WordPress plugin fix Core Web Vitals on its own?
A WordPress optimization plugin such as WP Rocket, LiteSpeed Cache or Perfmatters can improve Core Web Vitals by adding page caching, deferring scripts and removing unused assets. A plugin cannot fix structural problems like an oversized hero image, a bloated theme, too many third-party scripts or a slow server, so the best results come from pairing a plugin with fixes to the build itself.
What is Total Blocking Time and how does it relate to INP?
Total Blocking Time (TBT) is a Lighthouse lab metric that adds up how long long-running tasks blocked the browser’s main thread while the page loaded. Lighthouse uses TBT as a stand-in for Interaction to Next Paint because a lab test has no real person clicking. A low TBT is a good sign, but real-user INP can still be poor if later interactions trigger heavy JavaScript.