
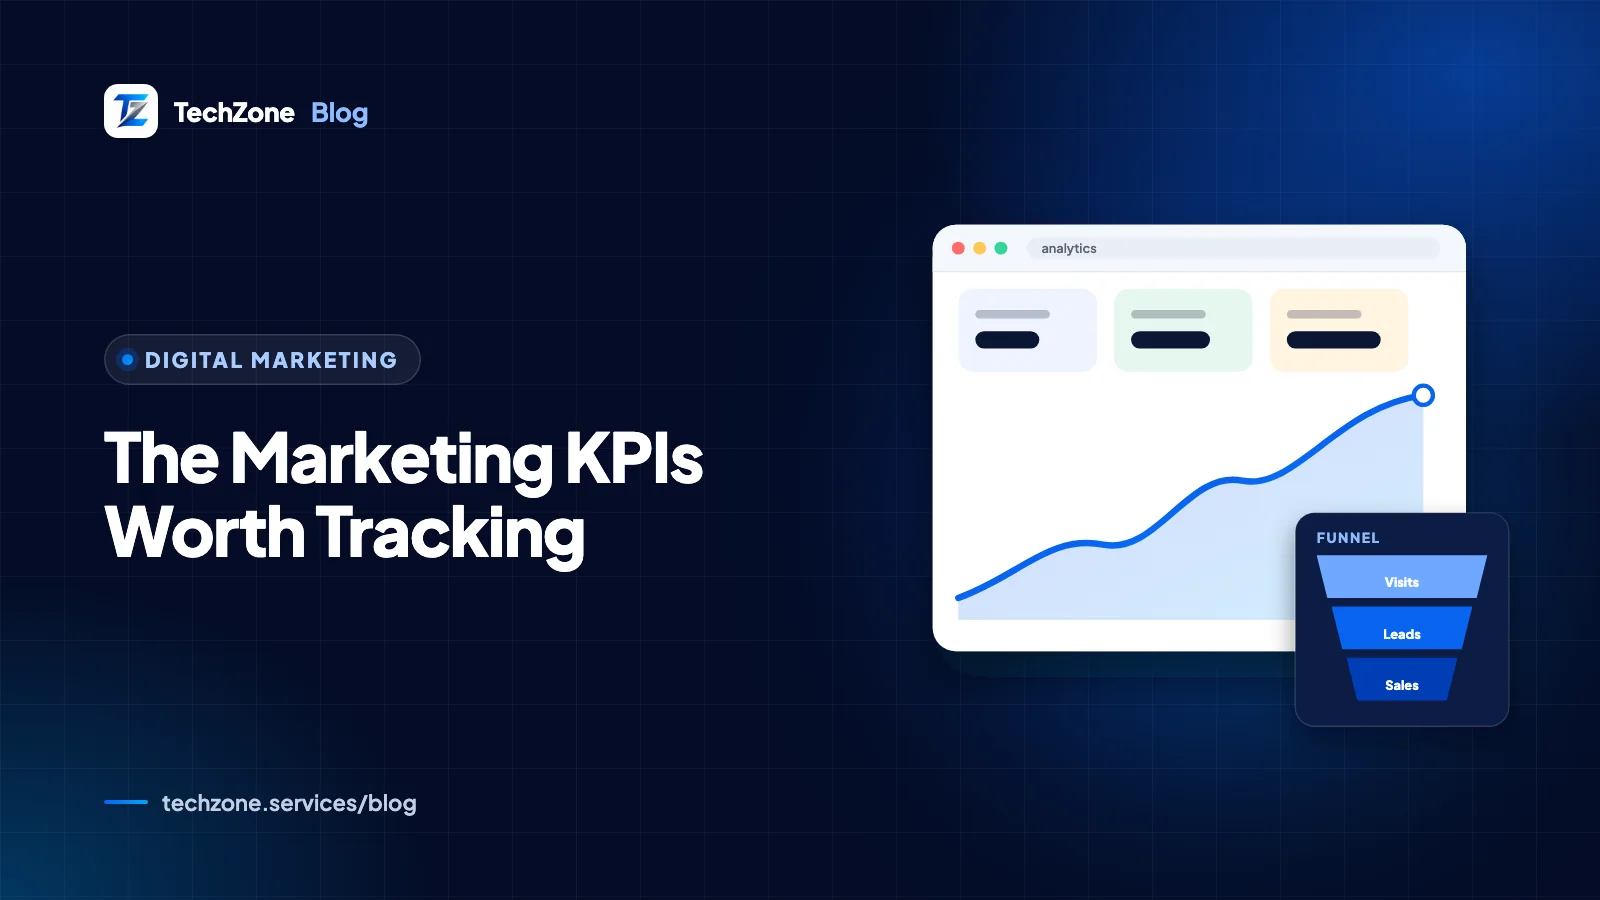
The digital marketing KPIs worth tracking are the few numbers that connect marketing to revenue: leads or sales, cost per lead or acquisition, conversion rate and return on spend, plus one or two early-warning metrics per channel. Choose them from your business goal, not from whatever a tool shows by default.
This guide lists KPIs by funnel stage and by channel, with the formula and where to find each one in GA4, Google Ads, Search Console and Google Business Profile. It also covers vanity metrics, UTM tagging rules, a one-page dashboard and how often to review it all.
Key takeaways
- A KPI is a metric tied to a goal, with a target and an owner; most small businesses need five to eight.
- Lagging KPIs such as leads, sales and cost per acquisition show results; leading indicators such as impressions and click-through rate warn you early.
- GA4 calls important actions key events; conversions are the actions Google Ads measures and bids toward.
- Tag every non-Google link with lowercase UTM parameters, including your Business Profile website link, and let auto-tagging handle Google Ads.
- Review leading indicators weekly, KPIs monthly and targets quarterly, from one dashboard everyone reads.
What makes a metric a KPI?
A metric is any number a platform reports; a KPI (key performance indicator) is a metric you’ve tied to a business goal, given a target and assigned to someone. “Sessions” is a metric. “25 inquiries a month from organic search” is a KPI.
Most small businesses need one headline number, usually leads or revenue, plus two or three KPIs per active channel. Start from your business model:
| Business model | Headline KPI | Supporting KPIs |
|---|---|---|
| Local service business (clinic, contractor, salon) | Qualified leads: calls, forms, WhatsApp chats and bookings | Cost per lead, lead-to-customer rate, Business Profile calls |
| B2B services | Qualified leads or sales meetings | Cost per qualified lead, pipeline value, time to close |
| Online store | Revenue | Conversion rate, average order value, return on ad spend, repeat purchase rate |
| Cash-on-delivery store | Delivered orders and delivered revenue | Return and refusal rate, cost per delivered order |
For cash-on-delivery stores, which are common in Pakistan, count orders that were delivered and paid for, not orders placed. A campaign that brings many refused parcels can look profitable on placed orders and still lose money.
Which KPIs should you track at each stage of the funnel?
Track one or two numbers at each stage, from being seen to getting paid. Lagging KPIs at the bottom tell you whether marketing worked; leading indicators at the top tell you early whether it’s likely to.
| Stage | Example KPIs | Type | Where to find it |
|---|---|---|---|
| Awareness | Impressions, reach, search impression share, searches for your brand name | Leading | Search Console, Google Ads, Meta Ads Manager, Business Profile Performance |
| Engagement | Click-through rate, engaged sessions, engagement rate | Leading | Ad platforms, GA4 Traffic acquisition |
| Conversion | Key events (leads, bookings, purchases), conversion rate, cost per lead | Lagging | GA4, Google Ads, your CRM or lead sheet |
| Revenue and retention | Customers won, revenue, customer acquisition cost, return on ad spend, repeat purchases | Lagging | CRM, store platform, accounting system |
Leading indicators move first, so they’re what you watch weekly: a sudden drop in impressions or click-through rate shows up before leads fall. Lagging KPIs are what you set targets on. Keep both, but never judge a channel on leading indicators alone.
Five formulas worth knowing
- Conversion rate = key events ÷ sessions (GA4 calls this session key event rate), or conversions ÷ clicks in an ad platform.
- Cost per lead = marketing cost ÷ leads.
- Customer acquisition cost = marketing and sales cost ÷ new customers.
- Return on ad spend (ROAS) = revenue from ads ÷ ad cost.
- Marketing ROI = (gross profit from marketing − marketing cost) ÷ marketing cost.
Digital marketing KPIs examples by channel
Each channel has its own platform numbers, but they should all roll up to the same key events and customers. The tables show the KPI, how it’s calculated and where to find it in 2026.
SEO KPIs
| KPI | Definition or formula | Where to find it |
|---|---|---|
| Organic key events | Leads or sales from the Organic Search channel | GA4: Traffic acquisition report |
| Organic clicks and CTR | Clicks from Google; CTR = clicks ÷ impressions | Search Console: Performance, Search results |
| Average position for priority searches | Relative ranking, where 1 is the top position | Search Console, filtered by query |
| Leads by landing page | Key events for each page people enter on | GA4: Landing page report |
| AI assistant visits | Visits from ChatGPT, Gemini, Copilot and similar tools | GA4: the AI Assistant channel in Traffic acquisition |
GA4’s default channel group now has an AI Assistant channel, while visits from Google’s AI Overviews and AI Mode stay in Organic Search. For a full SEO reporting template, see what belongs in a monthly SEO report.
Google Ads KPIs
| KPI | Definition or formula | Where to find it |
|---|---|---|
| Conversions | Actions you’ve set up as conversions, such as leads, calls and purchases | Google Ads: Conversions column |
| Cost per conversion | Cost ÷ conversions | Google Ads: Cost / conv. column |
| Return on ad spend | Conversion value ÷ cost | Google Ads: Conv. value / cost column |
| Search impression share | Impressions received ÷ impressions you were eligible for | Google Ads: Competitive metrics, Search impr. share |
These numbers are only as good as your tracking. If conversions aren’t set up, or count page views instead of real inquiries, fix that first with our guide to Google Ads conversion tracking for forms, calls and sales.
Google Business Profile KPIs
For local businesses, many calls and direction requests come straight from the Business Profile and never touch the website. Its Performance report shows interactions, calls, website clicks, direction requests, messages, bookings and the searches people used to find you. Track calls, direction requests and website clicks monthly, and link the profile to GA4 under Admin, Product links, Google Business Profile links to see them next to your website data.
Social media KPIs
| KPI | Definition or formula | Where to find it |
|---|---|---|
| Leads or sales from social | Key events from the Organic Social and Paid Social channels | GA4: Traffic acquisition |
| Cost per result | Ad spend ÷ the result you optimized for | Meta Ads Manager, TikTok Ads Manager, LinkedIn Campaign Manager |
| Engagement rate | Interactions ÷ reach (define it once and keep it) | Native insights for each platform |
| Messages started | New conversations from posts or ads | Meta Business Suite inbox, WhatsApp Business |
Social platforms each define engagement differently, so compare a platform with itself over time, not with another platform. Our guide to measuring social media ROI covers attribution for social in more depth.
Email and WhatsApp KPIs
- Click rate = unique clicks ÷ delivered emails. Use it instead of open rate, which Apple’s Mail Privacy Protection distorts by stopping senders from seeing whether a message was opened.
- Leads or revenue per send, from GA4 key events with
utm_medium=email. - Unsubscribe and spam complaint rates, from your email platform, as a warning that you’re sending too often or to the wrong list.
- WhatsApp replies and orders, counted in your CRM or a simple sheet, because chats that happen inside WhatsApp never reach GA4.
Which marketing metrics are vanity metrics?
A vanity metric can rise while inquiries and sales stay flat. Keep these as context, never as the headline:
- Followers and page likes: an audience you don’t reach or convert is worth little. Watch messages and site visits from social instead.
- Impressions and reach on their own: useful as leading indicators, meaningless without clicks and key events behind them.
- Total sessions: off-topic or overseas visitors inflate traffic without adding customers. Track key events and conversion rate by channel.
- Email open rate: unreliable since privacy features began hiding opens.
- Bounce rate: in GA4 it’s simply the share of sessions that weren’t engaged, meaning they lasted 10 seconds or less, had no key event and viewed only one page. A one-page visit that ends in a call is a success.
How do you tag links with UTM parameters?
Add UTM parameters to every link you control that points to your website from outside Google Ads: emails, social posts and bios, WhatsApp broadcasts, QR codes and your Business Profile. Without them, GA4 lumps these visits into the wrong channel or into Direct, and you can’t tell how marketing performance differs by source.
- Always set
utm_source,utm_mediumandutm_campaign; Google’s URL builder guidance says missing parameters show up as (not set). - Use lowercase everywhere. Values are case sensitive, so
Facebookandfacebookbecome two rows in your reports. - Use mediums GA4 recognizes:
emailfor email,socialfor organic social,paid_socialfor social ads andorganicfor your Business Profile. - Don’t tag links between pages of your own site. The UTM values can replace the real source, so key events get credited to your own website.
- Leave Google Ads to auto-tagging. When a URL has both, GA4 uses the auto-tagged values, so manual tags only add clutter.
- Keep a shared sheet of approved sources, mediums and campaign names, and build every link from it.
Tagging the Business Profile website link with utm_medium=organic keeps those visits in Organic Search, while the campaign value lets you separate them from ordinary search visits. Use one campaign value per location if you have several. Example links:
Business Profile website link:
https://www.example.com/?utm_source=google&utm_medium=organic&utm_campaign=gbp-listing

Monthly newsletter:
https://www.example.com/offers/?utm_source=newsletter&utm_medium=email&utm_campaign=2026-10-offer

Instagram bio link:
https://www.example.com/?utm_source=instagram&utm_medium=social&utm_campaign=bio-link

Facebook ad, video version A:
https://www.example.com/quote/?utm_source=facebook&utm_medium=paid_social&utm_campaign=spring-promo&utm_content=video-a
How do you build a one-page KPI dashboard in Data Studio (formerly Looker Studio)?
Use Data Studio, the free Google reporting tool that was called Data Studio until Google renamed it in April 2026. Connect GA4, Search Console and Google Ads, plus a Google Sheet of leads and customers from your CRM, and fit everything that matters on one page.
- Top row, scorecards: leads, customers won, cost per lead and revenue or ROAS, each compared with the previous period.
- Middle, trend: a time-series chart of key events by channel over the last 13 months, so seasonality is visible.
- Bottom, channel table: for each channel, sessions, key events, cost, cost per key event and customers won.
- Filters: a date range control and, for multi-location businesses, a location or campaign filter.
The Sheet matters most. Platforms count form fills and calls, but only your own records know which leads became paying customers. If GA4 isn’t collecting key events yet, set that up first with our GA4 guide for beginners.
Tip
Published benchmarks usually come from other industries, countries or company sizes, so they rarely fit a local service business. Use your own trailing three-month average as the baseline, and set each target as an improvement on it.
How often should you review marketing KPIs?
Check leading indicators weekly, review KPIs against targets monthly, and reset targets and channel mix quarterly. Reviewing lagging KPIs daily only produces overreactions to normal swings.
| Cadence | What to check | Typical decision |
|---|---|---|
| Weekly (15 minutes) | Spend pacing, impressions, CTR, key events firing, broken forms or tracking | Fix problems, pause obvious waste |
| Monthly (1 hour) | Leads, customers, cost per lead and ROAS by channel against targets | Move budget between channels and campaigns |
| Quarterly (half a day) | Trends over three months, SEO progress, channel mix, targets | Reset targets, start or stop channels |
Write the KPIs, targets and review dates into your digital marketing plan, so every review compares results with what you set out to achieve.
If you’d rather have someone else set up the tracking and run the reviews, our digital marketing team reports on these numbers monthly.
How TechZone can help
TechZone sets up the measurement that makes KPIs trustworthy: GA4 key events, Google Ads conversions, UTM conventions, Business Profile links and a one-page dashboard that includes your real leads and sales. We work with businesses in Pakistan, the UK, the UAE, the USA, Canada and Australia, and agree scope and cost in a written proposal before we start. Our digital marketing services then use those numbers to decide where your budget goes. Book a free 30-minute consultation to review what you’re tracking today.
Frequently asked questions
How many KPIs should a small business track?
A small business should track one headline KPI, usually leads or revenue, plus two or three KPIs for each channel it actively uses. That typically adds up to five to eight numbers. More than that and nobody reads the report, or everyone picks the metric that makes their channel look good. Keep other metrics available for diagnosis, not on the front page.
What is a good conversion rate for a website?
A good website conversion rate depends on the industry, the offer, the traffic source and what counts as a conversion, so published averages rarely transfer to your business. A booking form for an emergency service converts very differently from a free-guide download. Measure your own conversion rate by channel and landing page for three months, then aim to improve on that baseline.
What is the difference between ROI and ROAS?
ROAS, or return on ad spend, divides revenue from ads by ad cost, so it ignores product costs, fees and management time. ROI, or return on investment, uses profit instead: gross profit from marketing minus total marketing cost, divided by that cost. A campaign can show a healthy ROAS and still lose money when margins are thin, which is why ROI is the better final check.
Can you track phone calls and WhatsApp chats as KPIs?
Phone calls and WhatsApp chats can be tracked as KPIs in two layers. Clicks on a tap-to-call or WhatsApp button can be recorded as GA4 key events, and Google Ads can count calls from ads. What happens inside the call or chat needs your own records, such as a CRM or a lead sheet, so you can see which conversations became customers.
What is the difference between a key event and a conversion?
In Google Analytics 4, a key event is any event marked as important to the business, such as a form submission or a purchase. A conversion is the version Google Ads uses to measure campaigns and optimize bidding, and it can be created from a GA4 key event. Google renamed GA4 conversions to key events so the two platforms count them consistently.
Sources and further reading
- URL builders: Collect campaign data with custom URLs – Analytics Help
- Default channel group – Analytics Help
- Conversions vs. key events in Google Analytics – Analytics Help
- Understand your Business Profile performance & insights – Google Business Profile Help
- Use Mail Privacy Protection on iPhone – Apple Support
- Data Studio returns as new home for Data Cloud assets – Google Cloud Blog